Giorgio Bedogni 1,2, Claudio Tiribelli 1 and Stefano Bellentani 1
1 Centro Studi Fegato, AREA Science Park, Basovizza, Trieste, Italy
2 Cattedra di Nutrizione Umana, Università di Modena and Reggio Emilia, Italy
1. Abstract
The ratio of body weight to squared stature, nowadays known as the body mass index (BMI), was proposed as an index of body shape in the late 19th century. BMI was rediscovered in the late 20th century as an index of body fat and started to be employed in population studies to investigate the association between body adiposity and disease. From these studies, BMI emerged as an important predictor of morbidity and mortality. However, BMI is not a pure index of adiposity because its numerator (body weight) is the sum of fat- and fat-free-tissues. Moreover, its association with disease is influenced by other factors such as age, gender, ethnic background, dietary habits and physical activity. Despite these limits, in our era of Evidence-based Medicine, the assessment of BMI is a central step in the evaluation and treatment of obesity, diabetes, hypertension and dyslipidemia and other complications of overweight.
2. Quételet’s Index
The ratio of body weight to squared stature (W/S2), nowadays known as the body mass index (BMI), was proposed as a measure of body shape by the Belgian anthropologist Adolphe Quételet in the late 19th century [1-4]. W/S2 was then just one of the many indexes used by anthropologists to control body weight for stature, i.e. to measure body shape [5], and was the option preferred by Quételet for adults [2, 3]. Of the plethora of weight-stature indexes developed in the last two hundred years [5], W/S2 is however the only one still in use today. Surprisingly, it is also the only one not to be remembered with the name of its inventor [3, 5]. Even if Quételet did not use W/S2 as an adiposity or prognostic index as we do today, the lack of acknowledgement for its discovery is surprising in view of the immense contributions given by this man to the fields of anthropology and statistics (not to mention sociology and astronomy) [2, 4, 6]. For instance, by showing that the heights of French conscripts and the chest circumferences of Scottish soldiers tended to be normally distributed, Quételet made the fundamental discovery that the normal curve could be used other than an error law applied to the movements of planets. He literally brought the normal curve from the skies to the earth, in the hope of building a new science of man [1]. This finding was central to the development of both anthropometry and statistics. Thus, even if W/S2 is not used today as it was by Quételet, we should always recall the great contributions of its inventor to anthropometry when using “his” index [3].
3. Body Mass Index as an Index of Adiposity
W/S2 might have been one of the many forgotten weight-stature indexes if it had not been rediscovered as an index of adiposity more than one hundred years after its introduction. The demonstration of an association between W/S2 and body fat gave a new life to Quételet’s index and the new name of BMI [5, 7-10]. As a demonstration of the success encountered by W/S2, the term “body mass index” entered the Medical Subject Heading of the National Library of Medicine in 1990. Here, BMI is defined as “one of anthropometric measures of body mass; it has the highest correlations with skinfolds and body density”. This definition reflects the fact that skinfolds [11] and body densitometry [12] were used to measure body fat in the first validation studies of BMI. The search for anthropometric indexes of adiposity has been fuelled by the hypothesis that excess body fat could be a risk factor for chronic disease [13]. Due to its simplicity, BMI offered the opportunity to study the relationship between body fat and disease in population studies. However, even if BMI is associated with fat-free tissues less than other weight-stature indexes [5, 13], its numerator (weight) is the sum of fat and fat-free tissues so that BMI cannot be considered a pure index of adiposity (Figure 1).
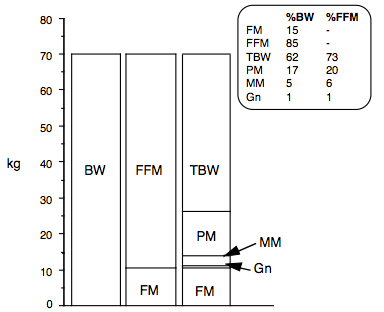
Figure 1. The two- and five-compartment models of body composition applied to the reference man. Body weight (BW) is the sum of fat mass (FM) and fat-free mass (FFM), which in turn is the sum of total body water (TBW), protein mass (PM), mineral mass (MM) and glycogen.
It should also be noted that, while the association of BMI with morbidity and mortality is now very clear (see next paragraph), only recently the association between body fat and chronic disease started to be investigated. The measurement of body fat requires in fact methods that are difficult to use in population studies because of logistical, economical and technical problems, besides the invasive nature of some of them [14].
BMI explains from 36 to 64% of the variability of percent body fat in adults and from 20 to 75% in children [15-18]. The error made by BMI in estimating percent body fat is usually acceptable at the population level but not at the individual level. To avoid misunderstandings, it must be pointed out that this is a problem of every indirect body composition technique, i.e. of every technique making use of predictive algorithms to estimate a body compartment [13]. The limitation of BMI as a measure of adiposity in the individual is exemplified by Figure 2 which reports the results obtained in 1413 Italian women aged 60-88 years [18]. The standard error of the estimate associated with the prediction of percent body fat from BMI in this population is 4.1%. The percent standard error of the estimate, obtained by dividing the standard error of the estimate by the mean value of percent body fat, is 11%. Even if this value is somewhat high, it can still be accepted for population studies. However, since the inter-individual variability in the percent body fat-BMI relationship is high, BMI cannot be used as an index of adiposity at the individual level. For instance, by looking at the regression plot in Figure 2, it may be observed that a woman with a BMI of 28 kg / m2 may have a percent body fat comprised between 30 and 50%.
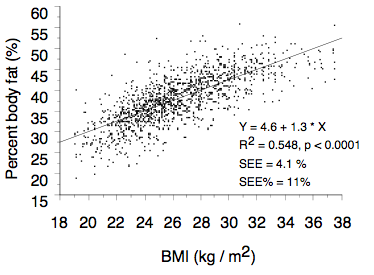
Figure 2. Relationship between percent body fat and BMI in a sample of 1423 Italian elderly women. Abbreviations: R2 = coefficient of determination; SEE = standard error of the estimate; SEE% = percent standard error of the estimate. Modified from Bedogni et al. [18].
The traditional approach to establish the accuracy of BMI as an index of body fat is to perform a regression analysis as described above. Another approach, which is more suitable for screening purposes, is based on the calculation of the sensitivity (true positive rate) and specificity (true negative rate) of BMI in detecting excess body fat [19]. BMI has generally a low sensitivity and a high specificity in detecting excess adiposity. For instance, in a study of 934 Italian children aged 8-12 years [20], sensitivity and specificity of BMI in detecting a value of percent body fat greater than the 85th percentile were 0.39 and 0.99 for the 95th percentile and 0.65 and 0.95 for the 85th percentile of BMI, respectively. When a direct measure of adiposity is needed, skinfold thicknesses offer a low-cost and easy way to evaluate subcutaneous adipose tissue [17]. In the study performed on Italian children [20], the sensitivity of the log-transformed sum of four skinfolds (biceps, triceps, subscapular and suprailiac [14]) in detecting excess adiposity were 0.75 and 0.94 for the 85th percentile. Thus, the use of the 85th percentile of the sum of four skinfolds instead of the 85th percentile of BMI may increase the sensitivity of screening programs of excess adiposity in children without any relevant loss in specificity.
The use of BMI as an index of adiposity is more difficult in children than in adults because of varying growth rates and maturity levels [21]. Standardization of BMI for age is always necessary in children to avoid spurious interpretations [21]. Likewise, similar values of BMI may reflect a different body composition in elderly as compared to young adults [22]. For instance, when matched with young women of similar weight and stature, elderly women have higher body fat and lower fat-free mass, total body water and bone mineral content [23]. There is also increasing evidence that the relationship between body fat and BMI may differ among individuals of different ethnic background [24, 25]. This evidence, together with that derived from epidemiological studies of morbidity and mortality (see next paragraph), has suggested the need of ethnic-specific BMI cut-off points [26].
4. Body Mass Index as A Prognostic Indicator
The great success encountered by BMI in our century is largely explained by its prognostic ability [22, 27-30]. The degree to which the association between BMI and disease is influenced by body fat is not yet known but it must remembered that BMI is not a pure index of body fat [5, 13]. For instance, both BMI and skinfolds are associated with disease [31-33] but the relationships are different so that studies using BMI as an index of adiposity should be interpreted with caution [33]. In addition, many factors influence the association between BMI and disease, the most significant being age, gender, ethnic background, dietary habits, physical activity and body fat distribution [13].
After an extensive review of the literature, the World Health Organization has classified the diseases associated with a high BMI in adults in three categories [27]: 1) the first (slightly increased risk, i.e. relative risk comprised between 1.0 and 2.0) includes cancer (breast, endometrium and colon), alterations of reproduction and fertility, polycystic ovary syndrome, low back pain, increased anesthetic risk and fetal defects; 2) the second (moderately increased risk, i.e. relative risk comprised between 2.0 and 3.0) includes chronic heart disease, hypertension, osteoarthritis (knees), hyperuricemia and gout; and 3) the third (greatly increased risk, i.e. relative risk greater than 3.0) includes gallbladder disease, dyslipidemia, insulin resistance, breathlessness and sleep apnea. In the last years, obesity has also emerged a strong risk factor for fatty liver [34]. In line with this conclusion is the finding that BMI is the single best predictor of an elevated alanine aminotransferase level in the general population [35].
BMI may be associated with disease also during childhood and adolescence [15, 16, 36]. The World Health Organization has classified the health consequences of obesity in children in three categories [27]: 1) the first category (high prevalence) includes faster growth, psychosocial problems, persistence into adulthood (for late onset and severe obesity), dyslipidemia and high blood pressure (not frank hypertension); 2) the second category (intermediate prevalence) includes fatty liver, abnormal glucose metabolism and persistence into adulthood (depending on age of onset and severity); and 3) the third category (low prevalence) includes orthopedic complications, sleep apnea, polycystic ovary syndrome, pseudotumor cerebri, gallbladder disease and
hypertension.
Most of the available data on the relationship between weight and mortality support the hypothesis of a curvilinear (J-shaped) association, with an increased risk of death among the very heavy and the very lean [37-52]. However, most of the studies suggesting that leanness may be a risk factor for death have been criticized for not having excluded smokers and subjects with coexisting disease [27, 53, 54]. On the other hand, some studies controlling for smoking status and concomitant disease have suggested that the relationship between excess weight and the risk of death may be linear, without an excess of mortality among the very lean [45, 46, 49, 51]. However, the lowest mortality rate was always found in subjects with a value of BMI comprised between 18.5 and 25.0 kg/m2 and this explains the choice of the cut-points for normal weight made by the World Health Organization [27] (see next paragraph).
A recent study, performed in more than 1 million US individuals followed for 14 years, supports the hypothesis of a J-shaped relationship between BMI and mortality [55]. A curvilinear association between BMI and mortality was in fact detected in: 1) current or former smokers with a history of disease; 2) current or former smokers without a history of disease; 3) subjects who had never smoked and with a history of disease; and 4) subjects who had never smoked and without a history of disease. In line with the expectations, smoking and a history of disease increased the risk of mortality among the very lean and the very heavy. In healthy people who had never smoked, the nadir of the curve for BMI and mortality was found at a value of BMI of 23.5 to 24.9 kg / m2 in men and 22.0 to 23.4 kg / m2 in women. White males and females with BMI of 40.0 kg / m2 and over had a relative risk of death of 2.58 and 2.00, respectively, as compared with those with a BMI between 23.5 and 24.9 kg / m2 (Figure 3). Black men and women with the highest BMI had however lower risks of death (1.35 and 1.21). A high BMI was most predictive of death from cardiovascular disease, especially in men. Collectively, the risk of death from all causes increased throughout the range of moderate and severe overweight for both men and women
in all age groups.
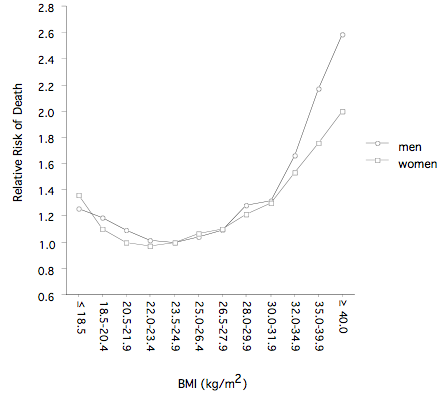
Figure 3. Relationship between the risk of death and BMI in US white mean and women. The graph was drawn from the data of Calle et al. [55].
A recent study, performed on about 900000 US individuals followed for 16 years, offers important new information on the relationship between BMI and the risk of death from cancer [56]. In men with BMI ≥ 40 kg/m2, the relative risk of death from cancer was 1.52 as compared to men with BMI between 18.5 and 24.9 kg/m2; in women with BMI ≥ 40 kg/m2, the relative risk of death from cancer was 1.62 as compared to women with BMI between 18.5 and 24.9 kg/m2. In both genders, BMI was significantly associated with higher rates of death due to cancer of the esophagus, colon and rectum, liver, gallbladder, pancreas, and kidney; the same was observed also for death due to non-Hodgkin’s lymphoma and multiple myeloma. Significant trends of increasing risk with higher BMI values were observed for death from cancers of the stomach and prostate in men and for death from cancers of the breast, uterus, cervix, and ovary in women. On the basis of these associations, it was estimated that the current patterns of overweight in the United States may account for 14 and 20 percent of all deaths from cancer in men and women
respectively [56].
5. Body Mass Index at Work
The classification of overweight proposed by the World Health Organization for adults is given in Table 1 [27]. This classification, based on the association between BMI and mortality (see previous paragraph), may not apply to non-caucasian populations [27]. This has been reemphasized more recently by an ad hoc committee of the World Health Organization asked to assess the need of different BMI cut-points for different ethnic backgrounds [26]. It should be noted that in this classification the term “overweight” applies to every value of BMI equal or greater than 25.0 kg/m2 so that obesity (BMI equal or greater than 30 kg/m2) is a “special case” of overweight [27]. In the classification of the US Expert Panel on the Identification, Evaluation and Treatment of Overweight in Adults [29], the term “overweight” is used instead to label a value of BMI comprised between 25.0 and 29.9 kg/m2. A classification of overweight for children should ideally be based on an association of BMI with disease such as that recognized for adults [57-59]. Because of the scarcity of data, however, BMI has been proposed as an index of adiposity in children mainly because of its association with adult BMI [15, 16, 60, 61]. The International Obesity Task Force (IOTF) has suggested to employ a value of BMI greater than the 95th percentile for age to diagnose “overweight” and one comprised between the 85th and 95th percentile for age to diagnose a “risk of overweight” in children [15, 16, 62]. Cole et al. have developed international reference values of BMI to be used in children and adolescents [62]. They have averaged the centile curves of about 190000 children aged 2-18 years obtained from six cross-sectional studies (Brazil, Great Britain, Hong Kong, Netherlands, Singapore and United States) and developed age- and sex-specific cut-points that, at an age of 18 years, pass through the cut-points of 25.0 and 30.0 kg/m2, the values used to define adult overweight and obesity (Table 2). Even if this definition is less arbitrary than others and offers the possibility of performing international comparisons, it should not be considered alternative to the use of local reference values (when available) because the two methods give often discordant results [63-65]. There is also some controversy as to whether BMI has the same prognostic value in adult and elderly subjects. The relative risk of death associated with adiposity seems in fact to decrease with increasing age [40, 46, 47, 50, 51]. In the study of Calle et al. [55], however, both relative and absolute measures of risk indicated that heavier men and women have an increased risk of death at all ages. The optimal BMI for longevity fell between 20.5 and 24.9 kg/m2 for men and women at all ages.
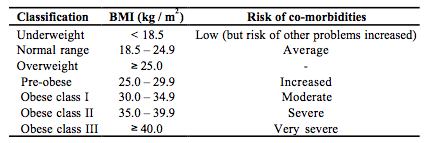
Table 1. Classification of Body Mass Index (BMI) for Adults [17] (See Text)
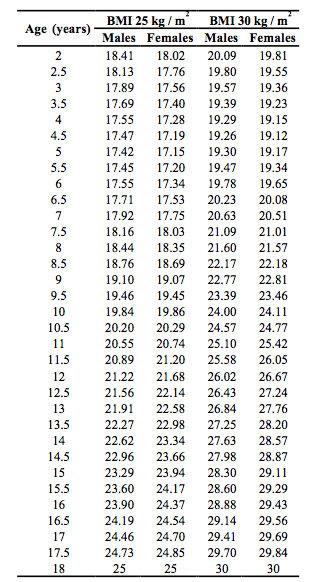
Table 2. International cut-off Points of BMI for the diagnosis of overweight and obesity in children defined to pass through BMI of 25 and 30 kg/m2 at age 18 [62] (See Text)
6. References
[1] Quételet L. Physique Sociale: ou essay sur le dévelopment des faculties de l’homme. Brussels: C Muquardt; 1869.
[2] Weigley ES. Adolphe Quetelet (1796-1874): pioneer anthropometrist. Nutrition Today. 1989;24:12-16.
[3] Weigley ES. Adolphe Quetelet (letter). Am J Clin Nutr. 2000;71:853.
[4] Jelliffe DB, Jelliffe EF. Underappreciated pioneers. Quetelet: man and index. Am J Clin Nutr. 1979;32:2519-2521.
[5] Cole TJ. Weight-stature indices to measure underweight, overweight and obesity. In:
Himes JH, ed. Anthropometric assessment of nutritional status. NY: Wiley-Liss; 1991:83-111.
[6] http://www-gap.dcs.st-and.ac.uk/~history/Mathematicians/Quetelet.html.
[7] Frisancho A, Flegel P. Relative merits of old and new indices of body mass with reference to skinfold thickness. Am J Clin Nutr. 1982;36:697-699.
[8] Garrow JS, Webster J. Quetelet’s index (w/h2) as a measure of fatness. Int J Obes Relat Metab Disord. 1985;9:147-153.
[9] Micozzi M, Albanes D, Jones D, Chumlea W. Correlations of body mass index with weight, stature, and body composition in men and women in NHANES I and II. Am J Clin Nutr. 1986;44:725-731.
[10] Leonhardt W, Hanefeld M, Julius U, et al. Predictive value of the desiderable body weight for total body fat mass as measured by dilution of tritiated water -problems and limitations. Int J Obes Relat Metab Disord.1987;11:221-228.
[11] Harrison G, Buskirk E, Linsday Carter J, et al. Skinfold thicknesses and measurement techniques. In: Lohman TG, Roche AF, Martorell R, eds. Anthropometric Standardization Reference Manual. Champaign IL: Human Kinetics Books; 1988:55-70.
[12] Going SB. Densitometry. In: Roche AF, Heymsfield SB, Lohman TG, eds. Human Body Composition. Champaign, IL: Human Kinetics; 1996:3-23.
[13] Seidell J. Relationship of total and regional body composition to morbidity and mortality. In: Roche AF, Heymsfield SB, Lohman TG, eds. Human body composition. Champaign, IL: Human Kinetics; 1996:345-351.
[14] Heymsfield SB, Wang ZM, Withers RT. Multicomponent molecular level models of body composition analysis. In: Roche AF, Heymsfield SB, Lohman TG, eds. Human body composition Champaign, IL: Human Kinetics; 1996:129-147.
[15] Dietz WH, Bellizzi MC. Introduction: the use of body mass index to assess obesity in children. Am J Clin Nutr. 1999;70 (Suppl):123S-125S.
[16] Bellizzi C, Dietz WH. Workshop on childhood obesity: summary of the discussion. Am J Clin Nutr. 1999;70:173S-175S.
[17] Norgan N. Anthropometric assessment of body fat and fatness. In: Himes JH, ed. Anthropometric Assessment of nutritional status. NY: Wiley-Liss; 1991:197-212.
[18] Bedogni G, Pietrobelli A, Heymsfield SB, et al. Is body mass index a measure of adiposity in elderly women? Obes Res. 2001;9:17-20.
[19] Lazarus R, Baur L, Webb K, Blyth F. Body mass index in screening for adiposity in children and adolescents: systematic evaluation using receiver operating characteristic curves. Am J Clin Nutr. 1996;63:500-506.
[20] Bedogni G, Iughetti L, Ferrari M, et al. Sensitivity and specificity of body mass index and skinfold thicknesses in detecting excess adiposity in children aged 8-12 years. Ann Hum Biol. 2003;30:132-139.
[21] Maynard L, Wisemandle M, Roche AF, Chumlea WC, Guo S, Siervogel R. Childhood body composition in relation to body mass index. Pediatrics. 2001:344-350.
[22] World Health Organization. Physical status: the use and interpretation of anthropometry. World Health Organization Technical Report Series 854 Geneva; 1995.
[23] Mazariegos M, Wang ZM, Gallagher D, et al. Differences between young and old females in the five levels of body composition and their relevance to the two-compartment model. J Gerontol. 1994;49:M201-208.
[24] Fernandez JR, Heo M, Heymsfield SB, et al. Is percentage body fat differentially related to body mass index in Hispanic Americans, African Americans, and European Americans ? Am J Clin Nutr. 2003;77:71-75.
[25] Deurenberg P, Deurenberg-Yap M, Foo LF, Schmidt G, Wang J. Differences in body composition between Singapore Chinese, Beijing Chinese and Dutch children. Eur J Clin Nutr. 2003;57:405-409.
[26] World Health Organization Expert Committee. Appropriate body-mass index for Asian populations and its implications for policy and intervention strategies. Lancet 2004;363:157-163.
[27] World Health Organization. Obesity: preventing and managing the global epidemic. Geneva; 1998.
[28] Chobanian AV, Bakris GL, Black HR, et al. The Seventh Report of the Joint National Committee on Prevention, Detection, Evaluation, and Treatment of High Blood Pressure: the JNC 7 report. JAMA. 2003;289:2560-2572.
[29] Clinical guidelines on the identification, evaluation, and treatment of overweight and obesity in adults: executive summary. Expert Panel on the Identification, Evaluation, and Treatment of Overweight in Adults. Am J Clin Nutr. 1998;68:899-917.
[30] Executive Summary of The Third Report of The National Cholesterol Education Program (NCEP) Expert Panel on Detection, Evaluation, and Treatment of High Blood Cholesterol In Adults (Adult Treatment Panel III). JAMA. 2001;285:2486-2497.
[31] Frisancho A. Anthropometric Standards for the Assessment of Growth and Nutritional Status. Ann Arbor: The University of Michigan Press; 1990.
[32] Gillum RF, Mussolino ME, Madans JH. Body fat distribution and hypertension incidence in women and men. The NHANES I Epidemiologic Follow-up Study. Int J Obes Relat Metab Disord. 1998;22:127-134.
[33] Twisk JW, Kemper HC, van Mechelen W, Post GB, van Lenthe FJ. Body fatness: longitudinal relationship of body mass index and the sum of skinfolds with other risk factors for coronary heart disease. Int J Obes Relat Metab Disord. 1998;22:915-922.
[34] Bedogni G, Bellentani S. Fatty liver: how frequent is it and why ? Ann Hepatol. 2004;3:63-65.
[35] Bedogni G, Miglioli L, Battistini N, Masutti F, Tiribelli C, Bellentani S. Body mass index is a good predictor of an elevated alanine transaminase level in the general population: hints from the Dionysos study. Dig Liver Dis. 2003;35:648-652.
[36] Iughetti L, De Simone M, Bernasconi S, Predieri B, Battistini N, Bedogni G. Relationship between body mass index and insulin measured during oral glucose tolerance testing in severely obese children and adolescents. Ann Hum Biol. 2004;31:196-201.
[37] Lew E, Garfinkel I. Variations in mortality by weight among 750000 men and women. J Chron Dis. 1979;32:563-576.
[38] Allison DB, Gallagher D, Heo M, Pi-Sunyer FX, Heymsfield SB. Body mass index and all-cause mortality among people age 70 and over: the Longitudinal Study of Aging. Int J Obes Relat Metab Disord. 1997;21:424-431.
[39] Cornoni-Huntley JC, Harris TB, Everett DF, et al. An overview of body weight of older persons, including the impact on mortality. The National Health and Nutrition Examination Survey I - Epidemiologic Follow-up Study. J Clin Epidemiol. 1991;44:743753.
[40] Diehr P, Bild DE, Harris TB, Duxbury A, Siscovick D, Rossi M. Body mass index and mortality in nonsmoking older adults: the Cardiovascular Health Study. Am J Public Health 1998;88:623-629.
[41] Durazo-Arvizu R, Cooper RS, Luke A, Prewitt TE, Liao Y, McGee DL. Relative weight and mortality in U.S. blacks and whites: findings from representative national population samples. Ann Epidemiol. 1997;7:383-395.
[42] Folsom AR, Kaye SA, Sellers TA, et al. Body fat distribution and 5-year risk of death in older women. JAMA 1993;269:483-487.
[43] Garfinkel L. Overweight and mortality. Cancer 1986;58:1826-1829.
[44] Harris T, Cook EF, Garrison R, Higgins M, Kannel W, Goldman L. Body mass index and mortality among nonsmoking older persons. The Framingham Heart Study. JAMA 1988;259:1520-1524.
[45] Lee IM, Manson JE, Hennekens CH, Paffenbarger RS. Body weight and mortality. A 27year follow-up of middleaged men. JAMA. 1993;270:2823-2828.
[46] Lindsted K, Tonstad S, Kuzma JW. Body mass index and patterns of mortality among Seventh-day Adventist men. Int J Obes. 1991;15:397-406.
[47] Lindsted KD, Singh PN. Body mass and 26-year risk of mortality among women who never smoked: findings from the Adventist Mortality Study. Am J Epidemiol. 1997;146:111.
[48] Losonczy KG, Harris TB, Cornoni-Huntley J, et al. Does weight loss from middle age to old age explain the inverse weight mortality relation in old age ? Am J Epidemiol. 1995;141:312-321.
[49] Manson JE, Willett WC, Stampfer MJ, et al. Body weight and mortality among women. N Engl J Med. 1995;333:677-685.
[50] Singh PN, Lindsted KD. Body mass and 26-year risk of mortality from specific diseases among women who never smoked. Epidemiology. 1998;9:246-254.
[51] Stevens J, Cai J, Pamuk ER, Williamson DF, Thun MJ, Wood JL. The effect of age on the association between body-mass index and mortality. N Engl J Med. 1998;338:1-7.
[52] Troiano RP, Frongillo EA, Sobal J, Levitsky DA. The relationship between body weight and mortality: a quantitative analysis of combined information from existing studies. Int J Obes Relat Metab Disord. 1996;20:63-75.
[53] Willett WC, Stampfer M, Manson J, VanItallie T. New weight guidelines for Americans: justified or injudicious? Am J Clin Nutr. 1991;53:1102-1103.
[54] Manson JE, Stampfer MJ, Hennekens CH, Willett WC. Body weight and longevity. A reassessment. JAMA
1987;257:353-358.
[55] Calle EE, Thun MJ, Petrelli JM, Rodriguez C, Heath CW. Body mass index and mortality in a prospective cohort of US adults. New Engl J Med. 1999;341:1097-1105.
[56] Calle EE, Rodriguez C, Walker-Thurmond B, Thun MJ. Overweight, obesity and mortality from cancer in a prospectively studies cohort of US adults. New Engl J Med. 2003;348:1625-1638.
[57] Must A, Jacques PF, Dallal GE, Bajema CJ, Dietz WH. Long-term morbidity and mortality of overweight adolescents. A follow-up of the Harvard Growth Study of 1922 to 1935. N Engl J Med. 1992;327:1350-1355.
[58] Freedman DS, Khan LK, Dietz WH, Srinivasan SR, Berenson GS. Relationship of childhood obesity to coronary heart disease risk factors in adulthood: the Bogalusa Heart Study. Pediatrics. 2001;108:712-718.
[59] Freedman DS, Dietz WH, Tang R, et al. The relation of obesity throughout life to carotid intima-media thickness in adulthood: the Bogalusa Heart Study. Int J Obes Relat Metab Disord. 2004;28:159-166.
[60] Guo SS, Chumlea WC. Tracking of body mass index in children in relation to overweight in adulthood. Am J Clin Nutr. 1999;70:145S-148S.
[61] Guo SS, Huang C, Maynard LM, et al. Body mass index during childhood, adolescence and young adulthood in relation to adult overweight and adiposity: the Fels Longitudinal Study. Int J Obes Relat Metab Disord. 2000;24:1628-1635.
[62] Cole TJ, Bellizzi MC, Flegal KM, Dietz WH. Establishing a standard definition for child overweight and obesity worldwide: international survey. BMJ 2000;320:1240-1243.
[63] Reilly J. Assessment of childhood obesity: national reference data or international approach ? Obes Res. 2002;10:838-840.
[64] Flegal KM, Ogden CL, Wei R, Kuczmarski RL, Johnson CL. Prevalence of overweight in US children: comparison of US growth charts from the Centers for Disease Control and Prevention with other reference values for body mass index. Am J Clin Nutr. 2001;73:1086-1093.
[65] Flegal KM, Wei R, Ogden C. Weight-for-stature compared with body mass index-for-age growth charts for the United States from the Centers for Disease Control and Prevention. Am J Clin Nutr. 2002;75:761-766.
[66] Franz MJ, Bantle JP, Beebe CA, et al. Evidence-based nutrition principles and recommendations for the treatment and prevention of diabetes and related complications. Diabetes Care. 2003;26 Suppl 1:S51-61.